How to read your reports
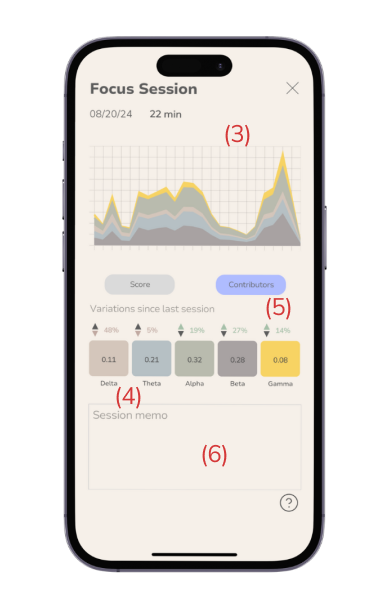
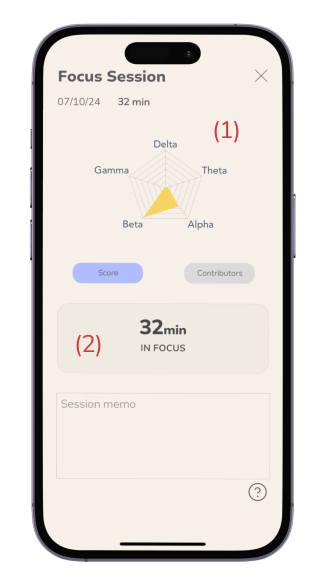
Each session report consists of two parts: (1) a brain activity snapshot that shows the dominant frequencies during the session; and (2) a session details chart showing the relative behavior of brainwave types throughout its duration.
Brain activity snapshot
A quick overview of your brain during your session.(1) Radar chart displays the distribution of the averaged relative values of your brain frequencies during your session. In this image, the session was dominated by beta waves, indicating a high level of focus.

(2) Session timer tracks the total duration of your session.
Session details
A time series chart tracking the behavior of each brainwave type throughout the session. The x-axis represents the session duration, and the y-axis represents the brainwave frequency microvolts).(3) The stacked area chart displays the power distribution of each brainwave frequency throughout the session's duration.

(4) The values in the boxes indicate the average relative contribution of each frequency type during your session.
(5) These values represent the percentage variation of each frequency band compared to your previous session of the same category.

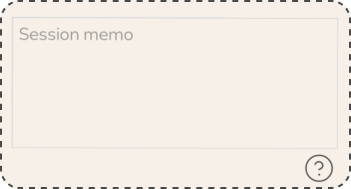
(6) The session memo allows you to input your personal notes and insights on your session. This feature helps you uncover patterns and insights over time.
How to interpret your frequencies during a session
Learning to interpret your brain activity during a session takes practice. It’s important to keep in mind that everyone’s brain signature is unique and responds differently to stimuli. For instance, some people may generate a lot of beta activity and can easily focus, while others may produce more theta waves and meditate deeply. Additionally, your cognitive performance can vary significantly across sessions, influenced by many factors such as stress, sleep quality, and nutrition. Understanding these variations can help you better utilize your brainwave data to achieve your desired mental states.
Here is a quick guide on what to look for in each type of session.
Flow
Look for a rise in synchronization between Theta and Beta frequencies, as this pattern plays a critical role during a flow state.
Focus
An increment in the ratio of Beta to Alpha waves is an indication of an increase in focus. Beta waves are linked to active, analytical thought.
Energy
An increase in the production of Beta waves reflects a state of mental engagement.
Calm
An increase in Alpha waves relative to Beta frequencies is associated with a relaxed state of mind.
Wind Down
Look for an increase in Theta frequencies. These waves are associated with early stages of sleep.
Sleep
Sleep is associated with the generation of Delta frequency waves, particularly during stages of deep sleep.